Caddy Reverse Proxy for Ceph Dashboard
· 6 min readThe Ceph Dashboard has a frustrating quirk — it runs on whichever node is the active ceph-mgr, and that can change during failovers. One day it’s on https://192.168.86.12:8443, the next it’s on .13. Since I already have a Caddy reverse proxy LXC handling Proxmox Web UI access, adding the Ceph Dashboard as a second site block is straightforward and solves the floating-IP problem.
The Problem
As covered in Adding Ceph Dashboard to Your Proxmox Cluster, the dashboard follows the active ceph-mgr service. In my cluster, all six nodes run ceph-mgr, and the dashboard is only accessible on the currently active manager. When a failover happens, your bookmark breaks.
The fix: proxy through Caddy with health checks across all mgr nodes. Caddy automatically detects which node is serving the dashboard and routes traffic there. This is the same active/standby service discovery pattern you’d use for any floating-VIP service — database clusters, message brokers, or any HA service where the active endpoint moves between nodes on failover.
Prerequisites
- Ceph Dashboard already configured and working (see the setup article)
- Caddy LXC already deployed (see Caddy Reverse Proxy for Proxmox Web UI)
- Know which nodes run ceph-mgr (in my cluster: all six nodes — .11 through .16)
Current State
Before this change, the Ceph Dashboard is accessible at whichever mgr node is active:
# Check which node has the active dashboard
ceph mgr services
Output shows something like:
{
    "dashboard": "https://192.168.86.12:8443/"
}
The dashboard uses HTTPS on port 8443 with self-signed certificates.
Adding Ceph Dashboard to the Caddyfile
SSH into the Caddy LXC (192.168.86.30) and edit /etc/caddy/Caddyfile to add a second site block. The Ceph Dashboard will listen on port 8443 on the proxy, keeping the same port convention:
# Proxmox Web UI (existing)
https://192.168.86.30 {
	reverse_proxy * {
		to 192.168.86.11:8006
		to 192.168.86.12:8006
		to 192.168.86.13:8006
		to 192.168.86.14:8006
		to 192.168.86.15:8006
		to 192.168.86.16:8006

		lb_policy ip_hash
		health_uri /
		health_interval 10s
		health_timeout 2s
		health_status 200

		transport http {
			tls_insecure_skip_verify
		}

		header_up Upgrade {http.request.header.Upgrade}
		header_up Connection {http.request.header.Connection}
	}
}

# Ceph Dashboard
https://192.168.86.30:8443 {
	reverse_proxy * {
		# All nodes run ceph-mgr
		to 192.168.86.11:8443
		to 192.168.86.12:8443
		to 192.168.86.13:8443
		to 192.168.86.14:8443
		to 192.168.86.15:8443
		to 192.168.86.16:8443

		lb_policy first
		health_uri /api/health
		health_interval 10s
		health_timeout 3s
		health_status 200

		transport http {
			tls_insecure_skip_verify
		}
	}
}
Why This Configuration Works
- All nodes listed — All six nodes run ceph-mgr, so all are included. The health check naturally finds whichever one is currently active.
lb_policy first— Routes to the first healthy upstream. Inactive mgr nodes still have port 8443 open, but they return errors — the health check is what distinguishes the active node from the standby ones.health_uri /api/health— The Ceph Dashboard’s/api/healthendpoint returns HTTP 200 without requiring authentication, making it reliable for health checks. The root path/redirects unauthenticated requests (HTTP 302), which would cause all nodes to fail thehealth_status 200check.- Port 8443 on the proxy — Keeps the familiar Ceph Dashboard port. You access
https://192.168.86.30:8443/instead of guessing which node is active. tls_insecure_skip_verify— Same rationale as the Proxmox proxy — Ceph uses self-signed certificates.- 3-second health timeout — Slightly longer than the Proxmox proxy because the Ceph Dashboard can be slower to respond under load.
Apply the Configuration
# Validate the config first
caddy validate --config /etc/caddy/Caddyfile

# Reload without downtime
caddy reload --config /etc/caddy/Caddyfile

# Or restart the service
systemctl restart caddy
Verify it’s listening on both ports:
ss -tlnp | grep caddy
Expected output:
LISTEN 0  4096  127.0.0.1:2019  0.0.0.0:*  users:(("caddy",pid=133,fd=16))
LISTEN 0  4096          *:8443      *:*  users:(("caddy",pid=133,fd=17))
LISTEN 0  4096          *:443       *:*  users:(("caddy",pid=133,fd=20))
LISTEN 0  4096          *:80        *:*  users:(("caddy",pid=133,fd=19))
You’ll see listeners on :443 (Proxmox UI), :8443 (Ceph Dashboard), and 127.0.0.1:2019 — that last one is the Caddy Admin API, which is enabled by default and useful for future config management.
Verify It Works
- Open
https://192.168.86.30:8443/in your browser - Accept the self-signed certificate warning
- You should see the Ceph Dashboard login page
- Log in with your Ceph Dashboard credentials
This is what you’ve been working toward — a stable, single URL for the full Ceph cluster overview, regardless of which node is currently the active ceph-mgr:
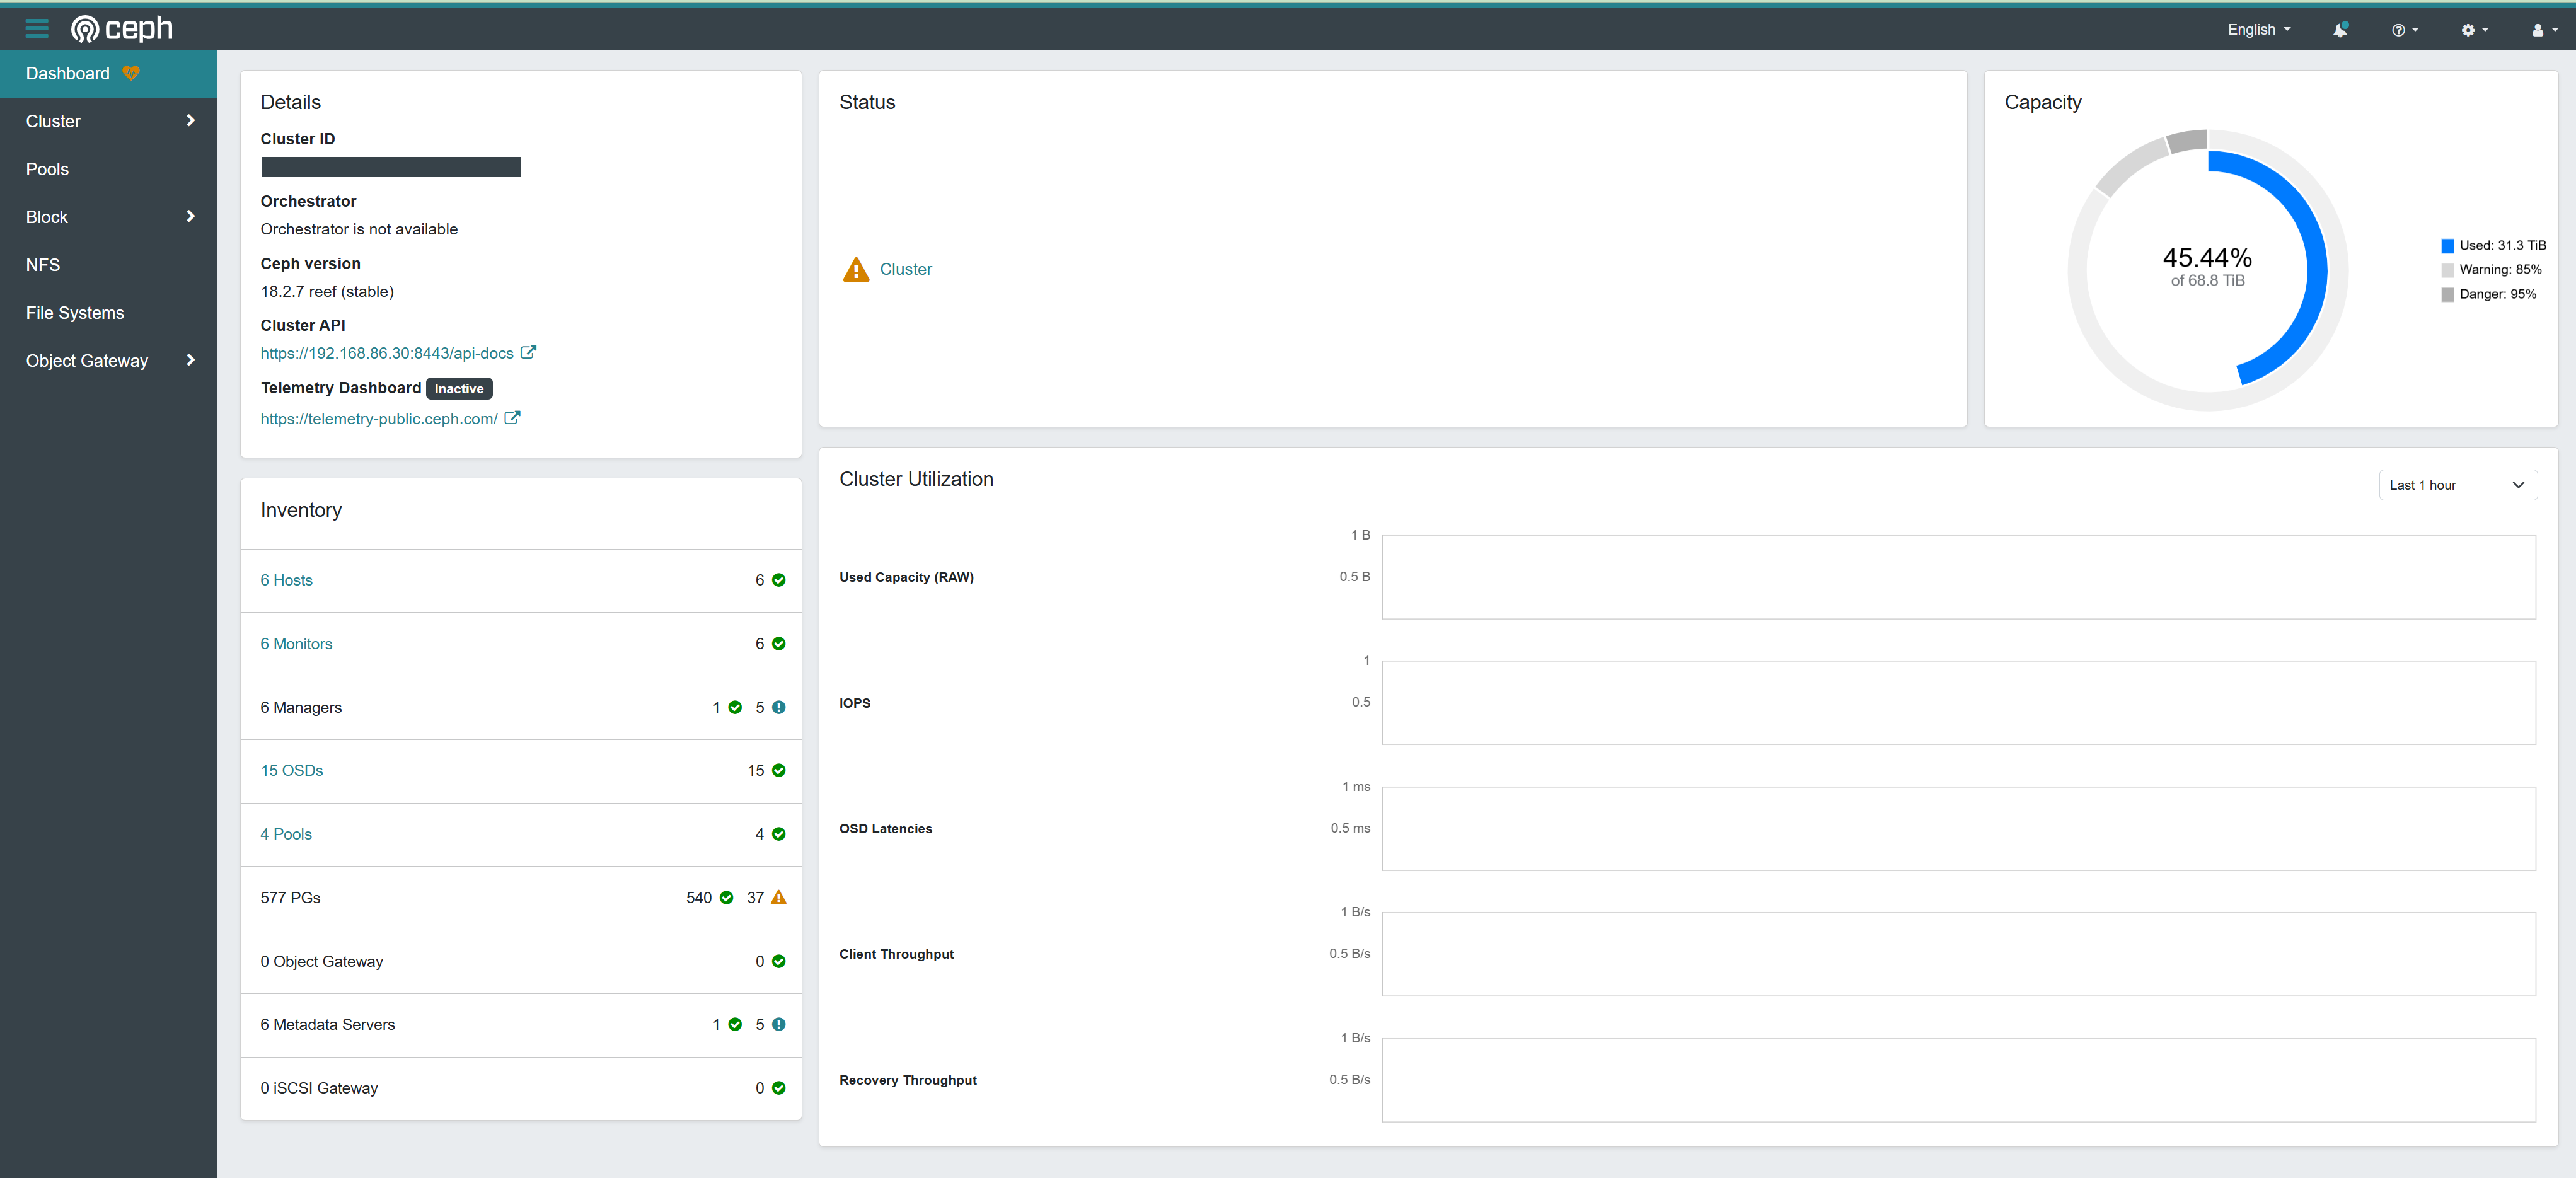
The dashboard shows cluster health, OSD status, pool utilization, and active alerts — everything you need to know about your Ceph cluster at a glance, now accessible from one bookmark that never breaks.
Test Failover
To verify the proxy handles mgr failovers correctly:
# Check current active mgr
ceph mgr stat

# Force a failover
ceph mgr fail $(ceph mgr stat | jq -r '.active_name')

# Wait 10-15 seconds for health checks, then reload the dashboard
# It should still work through the proxy
Troubleshooting
Dashboard Returns 503
All mgr nodes are failing health checks. Verify the dashboard is actually running:
ceph mgr services
If the dashboard key is missing, the module may need to be re-enabled:
ceph mgr module disable dashboard
ceph mgr module enable dashboard
Slow Dashboard Loading
The Ceph Dashboard can be sluggish, especially the first load after a mgr failover. The health_timeout 3s setting accounts for this, but if you’re seeing consistent timeouts, increase it:
health_timeout 5s
Port Conflict
If something else is already using port 8443 on the LXC, pick a different port:
https://192.168.86.30:9443 {
    # ... same config
}
The Complete Caddyfile
The full /etc/caddy/Caddyfile combines both site blocks shown above — the Proxmox Web UI proxy (from the companion article) and the Ceph Dashboard proxy added here. Both live in the same file and Caddy serves them simultaneously on different ports (443 and 8443).
Future Improvements
-
DNS names — Technitium DNS is already running split-horizon for
home.mcgarrah.org, resolving internal names to private IPs while Porkbun handles public DNS. Adding aceph.home.mcgarrah.orgA record pointing to192.168.86.30(the Caddy LXC) means internal clients resolve the friendly name while external queries go nowhere — keeping the dashboard off the public internet by design. Replace the IP-based Caddyfile block with a hostname-based one:ceph.home.mcgarrah.org:8443 { reverse_proxy * { # ... same upstream config } } - Proper TLS — With the DNS name in place, Caddy can obtain a trusted certificate via ACME DNS-01 challenge using the Porkbun API, eliminating the self-signed certificate warning entirely
- Caddy Admin API — Caddy exposes a REST API on
localhost:2019by default (visible in thessoutput above). This allows JSON-based config updates without touching the Caddyfile directly. It’s local-only by default, which is safe — access it via an SSH tunnel if you want to drive it remotely - Additional services — Grafana, Prometheus, and other monitoring dashboards through the same proxy
- SSO integration — Authentik or Keycloak for unified authentication
Related Articles
- Adding Ceph Dashboard to Your Proxmox Cluster — Initial Ceph Dashboard setup
- Caddy Reverse Proxy for Proxmox Web UI — The Proxmox proxy this builds on
- Proxmox & Ceph Homelab Guide — All my Proxmox and Ceph articles in one place